
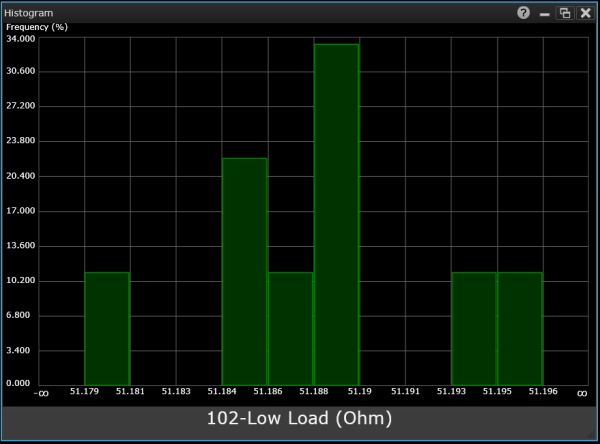
Display scan data as a histogram for the current reading for the selected channel. Groups are plotted on the x-axis using the units of measurement (volts, ohms, current, etc.) and frequencies are plotted on the y-axis. You can add up to two Histogram gadgets to the Graphics Setup tab (one channel per gadget).
Note: This gadget is available in the Scan Module configuration only. If you have selected the Switch Module configuration on the Instrument Settings tab, this gadget will not be allowed for this module.
Select the desired gadget window (the selected window is highlighted in blue) to display the Properties pane on the right side of the Graphics Setup tab. The available properties vary according to the type of gadget selected.
Caption - Enter the desired title to appear at the top of the current gadget window. You can specify a caption with up to 30 characters including letters, numbers, and special characters.
Select Channel - Select the desired channel to be displayed (the drop-down list is automatically pre-populated with all channels included in the current scan list).
Label Color - Select the desired color for the text label at the bottom of the histogram.
Minimum Value - Specify the lowest measured value to include in the histogram. For example, 1 Vdc (for DC voltage measurements) or 20 Hz (for frequency measurements).
Maximum Value - Specify the highest measured value to include in the histogram. For example, 10 Vdc (for DC voltage measurements) or 200 Hz (for frequency measurements).
Decimal Places - Specify the graticule label precision in number of digits to the right of the decimal (0 through 9).
Bins - Set the number of bins (containers that accumulate data) up to a maximum of 1,000 bins. Data in bins are shown in green and data outside of bins are shown in red.
Autoscale - When the check box is selected, all measurement data is automatically assigned to bins and displayed. When the check box is cleared, you can specify a Minimum Value and Maximum Value to be assigned to bins.
Show ∞ Bins - When the check box is selected, the -Infinite and +Infinite ranges are shown on the histogram.
Copy Image to Clipboard - Export a screen shot of the selected display gadget to the Windows clipboard.
Right-click anywhere on the histogram to display these options:
Save Chart Image to File - Export a screen shot of the chart to a JPEG, BMP, or PNG file, with a white grid on a black background. By default, the screen shot is stored in the "My Documents" folder on your computer. For example – C:\Users\<user_name>\Documents\Keysight\BenchVue\DAQ\Exports\.
Copy Chart Image to Clipboard - Export a screen shot of the chart to the Windows clipboard.